
Europe, Australia and New Zealand are the best places in the world to live, according to expats.
Eight European countries made the top 10 cut along with the two Australasian nations in the latest poll by expat monitor Numbeo.
Denmark comes out on top, closely followed by Switzerland and Finland..
At the bottom comes Bangladesh, grouped with several African and Asian countries.
The Quality of Life Index is a formula based on real-time data posted by expats from around the world.
Quality of life by country
How expats voted for the best quality of life in 77 countries – the best are coloured dark green, while the worst are in red.
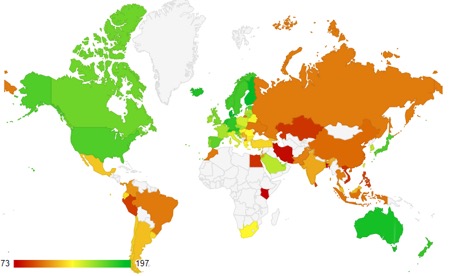
Source: Numbeo
Countries with the best quality of life for expats
New York City is the index base at 100, so 196.47 means Denmark has a quality of life 96.47% better than New York, while 69.3 for Bangladesh means its rated 30.7% worse.
| Rank | Country | Quality of Life | Purchasing Power | Safety | Health Care | Cost of Living | Property Price to Income | Traffic Commute Time | Pollution |
| 1 | Denmark | 196.47 | 110.69 | 75.28 | 79.22 | 83.88 | 7.52 | 29.60 | 20.79 |
| 2 | Switzerland | 196.08 | 127.76 | 78.82 | 73.23 | 122.67 | 9.11 | 29.12 | 21.31 |
| 3 | Finland | 195.06 | 108.78 | 77.25 | 75.27 | 72.18 | 7.88 | 30.62 | 11.57 |
| 4 | Australia | 189.73 | 118.09 | 57.30 | 76.82 | 73.39 | 7.68 | 35.66 | 23.15 |
| 5 | Iceland | 188.12 | 92.03 | 76.85 | 65.66 | 97.22 | 6.41 | 19.49 | 15.65 |
| 6 | Austria | 187.82 | 89.88 | 76.77 | 79.46 | 72.15 | 10.64 | 25.41 | 21.78 |
| 7 | Netherlands | 186.41 | 98.04 | 71.46 | 75.63 | 75.22 | 7.52 | 29.42 | 27.34 |
| 8 | Germany | 184.30 | 111.99 | 65.40 | 73.58 | 66.57 | 9.42 | 30.39 | 28.42 |
| 9 | New Zealand | 183.07 | 97.59 | 59.11 | 73.71 | 73.01 | 8.51 | 30.72 | 23.49 |
| 10 | Sweden | 180.52 | 112.75 | 52.79 | 69.41 | 70.11 | 9.61 | 30.04 | 17.45 |
Source: Numbeo
Countries with the worst quality of life for expats
| Rank | Country | Quality of Life | Purchasing Power | Safety | Health Care | Cost of Living | Property Price to Income | Traffic Commute Time | Pollution |
| 68 | Hong Kong | 99.58 | 66.79 | 81.90 | 66.93 | 79.21 | 49.38 | 41.09 | 67.34 |
| 69 | Sri Lanka | 89.48 | 25.59 | 59.85 | 72.98 | 32.95 | 29.60 | 55.54 | 58.38 |
| 70 | Philippines | 88.23 | 27.21 | 58.91 | 66.45 | 36.97 | 23.63 | 43.87 | 74.55 |
| 71 | Peru | 88.14 | 37.42 | 35.42 | 56.26 | 38.82 | 14.75 | 49.16 | 84.60 |
| 72 | Kazakhstan | 85.88 | 38.65 | 35.77 | 50.20 | 30.06 | 11.69 | 31.64 | 75.42 |
| 73 | Egypt | 85.42 | 23.27 | 51.47 | 44.76 | 29.09 | 13.60 | 48.28 | 86.31 |
| 74 | Vietnam | 85.10 | 30.22 | 51.78 | 55.24 | 38.17 | 22.55 | 29.65 | 86.29 |
| 75 | Iran | 75.22 | 25.95 | 50.97 | 51.86 | 41.39 | 24.88 | 48.02 | 78.03 |
| 76 | Kenya | 73.14 | 29.34 | 37.62 | 54.98 | 39.26 | 31.34 | 56.11 | 74.01 |
| 77 | Bangladesh | 69.30 | 37.21 | 35.02 | 42.55 | 32.62 | 12.87 | 57.08 | 88.81 |
Source: Numbeo