
Buy-to-let tenants are paying more rent than ever as housing costs go through the roof in the UK.
Table of contents
A lack of housing and the soaring cost of living combined to give private landlords a huge financial boost.
Official data from the Office for National Statistics shows landlords have never had it so good as rents hit record levels in June.
Renters face a three per cent year-on-year rise in the cost of new tenancies – the fastest monthly rent growth since records started in January 2015.
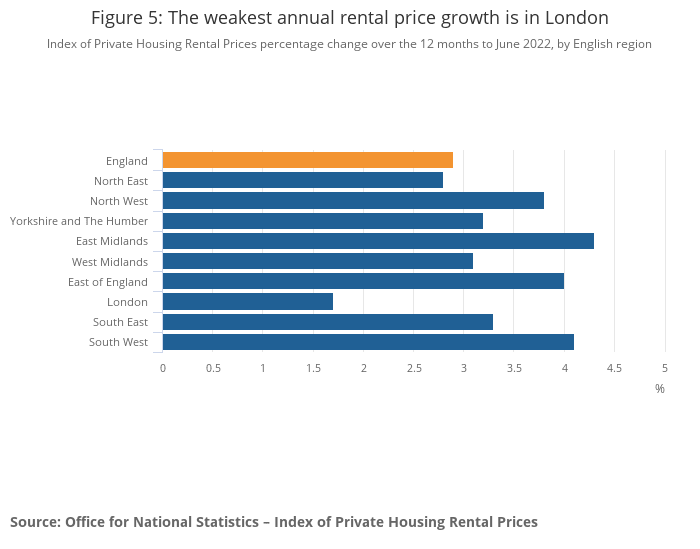
However, the picture is not the same for tenants in different parts of the country.
London Rents Sluggish
The most rapid rent increase is in the East Midlands, where tenants paid 4.3 per cent more than 12 months ago.
The most sluggish rent increase was in London, where landlords are settling for rises of 1.7 per cent year-on-year.
Letting agent trade body the Association of Residential Landlords (ARLA) says on average, a letting agent branch had 93 new tenant applicants looking for homes from a stock of 11 properties for rent in June.
CEO Nathan Emerson said: “It is good to see a slight increase in stock levels this month, but with that being said, this barely scratches the surface on what is needed to limit the ever-widening gap between supply and demand.
“There is a decreasing number of incentives for landlords to remain within the sector, especially with the many incoming regulatory pressures on the horizon. We need reassurance from all Governments that they will address this increasingly pressing issue and ease the pressure within the private rented sector.”
UK Buy to let hotspots
The East Midlands and South West have rivalled each other for months as the region with the strongest rent growth.
For the past three months, the East Midlands has come out on top and leads the way again in June with a 4.3 per cent year-on-year increase. The South West posted a 4.1 per cent rise, just ahead of the East of England with a 4.0 per cent change.
London scored the lowest, with rents rising 1.8 per cent. The next lowest was the North East, with a 2.8 per cent increase.
Beware of the house price rollercoaster which seems to be starting in many hot spots.
Tenants Worry About Paying Bills
Meanwhile, tenant referencing agency Homelet warns that a survey found that four out of five renters are concerned about how they will pay their rent and other vital bills.
The same survey also revealed tenants falling into rent arrears is a major worry for landlords, too.
Rob Wishart, Homelet’s head of business intelligence, said: “There is a shortage of housing stock in this country, and this is a phenomenon that is only getting worse as many landlords are deciding that they would prefer to leave the market altogether. If we continue to see a decline in the number of landlords, tenants are likely to pay the price, as a shortage of supply will see an increase in demand, making further price rises inevitable
“ It is easy to see where the problems lie, and it is hard to see how the Renter’s Reform Bill will help address the issue.
“The impacts of inflation, the war in Ukraine, energy price and other cost increases, are all combining to squeeze households up and down the country. This month’s rental figures also show a rise, and it is relatively easy to surmise that all of the issues above will lead to an increased number of tenants unable to pay their rent, which is a bad thing for everyone.”
Average Rent Tops £1,100 A Month
Wishart explained that average monthly rents now topped £1,100 after rising 10.9 per cent in a year.
The North East was the only area with rents falling into the red – with a 0.3 per cent drop.
London rents remain the most expensive, averaging £1,846 a month after a 14.9 per cent yearly increase.
| Region | June-22 | June-21 | Yearly change | May-22 | Monthly change |
| Greater London | £1,846 | £1,607 | 14.90% | £1,832 | 0.80% |
| South West | £1,053 | £948 | 11.10% | £1,051 | 0.20% |
| North West | £883 | £799 | 10.50% | £879 | 0.50% |
| Scotland | £812 | £738 | 10.00% | £786 | 3.30% |
| West Midlands | £826 | £754 | 9.50% | £819 | 0.90% |
| East Midlands | £770 | £704 | 9.40% | £761 | 1.20% |
| Yorkshire & Humberside | £761 | £701 | 8.60% | £757 | 0.50% |
| South East | £1,190 | £1,105 | 7.70% | £1,181 | 0.80% |
| North East | £588 | £547 | 7.50% | £590 | -0.30% |
| Wales | £752 | £702 | 7.10% | £740 | 1.60% |
| East of England | £1,071 | £1,005 | 6.60% | £1,062 | 0.80% |
| UK | £1,113 | £1,007 | 10.50% | £1,103 | 0.90% |
| UK excluding London | £936 | £861 | 8.70% | £928 | 0.90% |
UK Buy To Let Rent FAQ
What are average rents based on?
Statisticians take the total paid in rent for the time divided by the number of properties to give an average rent. The figure is then compared to the previous year’s workings to give an increase or decrease.
Are the rent figures accurate?
Always investigate local rents with letting agents and other property professionals. Do not take average figures as real rent returns for a home because several local factors will influence the actual price a tenant should pay for a home.
Why is the rent data different between rent reports?
Each report is based on a different sample. For instance:
- The ONS is the biggest data sample and covers figures from HMRC and other official agencies.
- Homelet data is based on the firm’s customer base, which could be skewed across the country
- ARLA is a sentiment survey, which means the opinions are just that and not evidenced by supporting data
Should rent rises follow the statistics?
Setting rents is a business decision for each landlord based on local factors, not data from areas with no link with a property.
Why are London landlords struggling with rents?
The reasons arose from Brexit and the COVID pandemic when thousands of foreign renters returned home, and many professionals were forced to work from home. Neither source of tenants has returned to the capital in great numbers. London also has an oversupply of homes to rent.
Related Information
Below is a list of related articles you may find of interest.